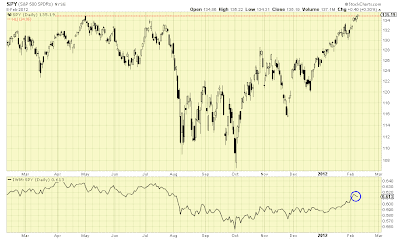
Now the S&P itself is about 12 points from its post crash high and maybe that's why no one noticed the high in the ETF. But what I want everyone to take away from the chart above is the price relative panel below which is comparing the strength of the Russell 2000 ETF (IWM) to SPY. As you can see I highlighted the downturn with the blue circle. The Russell 2000 has been leading the market higher during this bull leg and this recent relative weakness may be telling us something.
Also notice that price and momentum is waning on the Dow Transport chart (black arrow; top panel):
As I stated yesterday the market is climbing a "wall of worry" and as I watched the price action today I came away with the feeling the market almost wants an excuse to correct. Just a hunch but I'd bet that other than a sudden down draft from a Greek surprise or a curve ball out of the Mid East, any correction will be shallow or maybe even evaporate into a side-ways consolidation.


No comments:
Post a Comment