(click on the chart for a larger view)
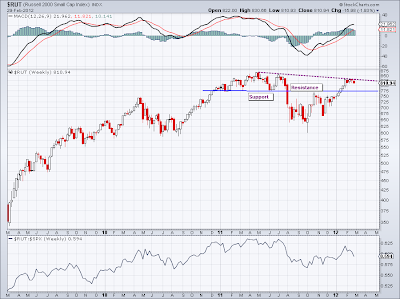
On the premise that prior resistance becomes support we can see from the weekly chart above that we have pretty strong support at 775 as that level supported the Russell throughout the first half of 2011 and was an equally strong resistance level from August 2011 to January 2012. It's true that the Russell has not exceeded its 2011 high (purple dashed line) but we cannot say this upward move is over until we have a breakdown below 775.
What's of greater concern is that the Russell is showing relative weakness to the S&P500 (bottom panel). As I stated yesterday, the Russell took the lead in the rally that commenced in late December. We need to see it regain its leadership as a signal that this market is starting the next leg higher.
To my anonymous reader, thanks for taking the time to comment!

No comments:
Post a Comment