
(click on charts for larger image)
This is the S&P 100 Index (OEX) which consists of the top 100 capitalized stocks on the S&P 500. During the 1980's it was, along with the Dow Industrials, the most followed index by market participants and especially options traders. The S&P 500 has now taken predominance. We've made a post crash high in the index and momentum indicators are solidly bullish. Notice the bottom panel which is a ratio of the S&P 100 and the Russell 2000 (RUT). The ratio is a bit counter intuitive but the OEX is under performing the Russell which means that small caps are leading this market higher. This is precisely the type of behavior we want to see in equities!

Let's look "under the hood" of the stock market:

Treasuries have, true to their inverse inter relationship to stocks, sold off but they have literally fallen out of bed disproportionately to the price action in equities:

Above is the iShares Barclays Seven to Ten Year Bond ETF. Notice the precipitous fall which the momentum indicators were predicting for some weeks (see my commentary on 7/27). We've bounced off a Fibonacci retracement level (blue arrow) but the candlesticks this week are telling us that IEF will likely penetrate this support and resume the downside next week. The same is true for the iShares Barclays 20+ Year Treasury Bond Fund ETF below:

Gold is still in the doldrums and doesn't know quite what to do:

We've been unable to penetrate the $1,625.00/$1,630.00 level I've been targeting (yellow line). Momentum indicators are neutral with a slight bias to the upside. We're starting to see some bullish action in the miners but it's muted. Here's a weekly chart of the Market Vectors Gold Mining ETF (GDX):
I believe investors are very confused about the direction of Gold, even if central banks start printing money. There's a growing realization that the inflationary expectations that were built in to the incredible eleven year rally in the precious metal must be questioned. I've been addressing this paradigm shift and the reasons why market participants are stuck in an inflationary mindset since I started these commentaries in 2010. Suffice to say we will see how Gold reacts if/when central banks start up the printing presses again.
Commodities continue to languish. I usually show the industrial metal indexes as they are more indicative of global economic conditions but today I'm posting the CRB Index which is a basket of commodities encompassing not just industrial metal, but agricultural and livestock commodities:

The CRB has been in an uptrend since early July when corn, soy beans and wheat soared to all time highs due to the extreme drought and heat conditions in most of the country. Even so, as those prices have moderated a bit the momentum indicators have turned down and the index has been hovering around a Fibonacci retracement line for the better part of two weeks. We have an intermediate to long term resistance line above the Fibonacci level (brown arrow). As long as the CRB stays at these levels or lower, inflationary pressures and expectations are nil!
Lastly, the currency markets have been sleepy as well. Here's the US Dollar Index and after backing off highs set in July it has been going nowhere for the past two weeks(white circle):

ANALYSIS
It's difficult to formulate an understanding of intermediate term market direction this week due to the incredibly low volume which tends to make price action amplified. Less volume equals less liquidity thereby making price action jerky. It's clearly evident that everyone is on vacation!
Thursday's "pop" in the market was solely the result of German Chancellor Angela Merkel making one of those "whatever it takes" statements.
I've stated a number of times that I'm suspicious of this rally and I've given some good reasons to be cautious. However, "fighting the tape" can be injurious to one's financial well being and the charts posted above clearly are telling us that this uptrend is intact.
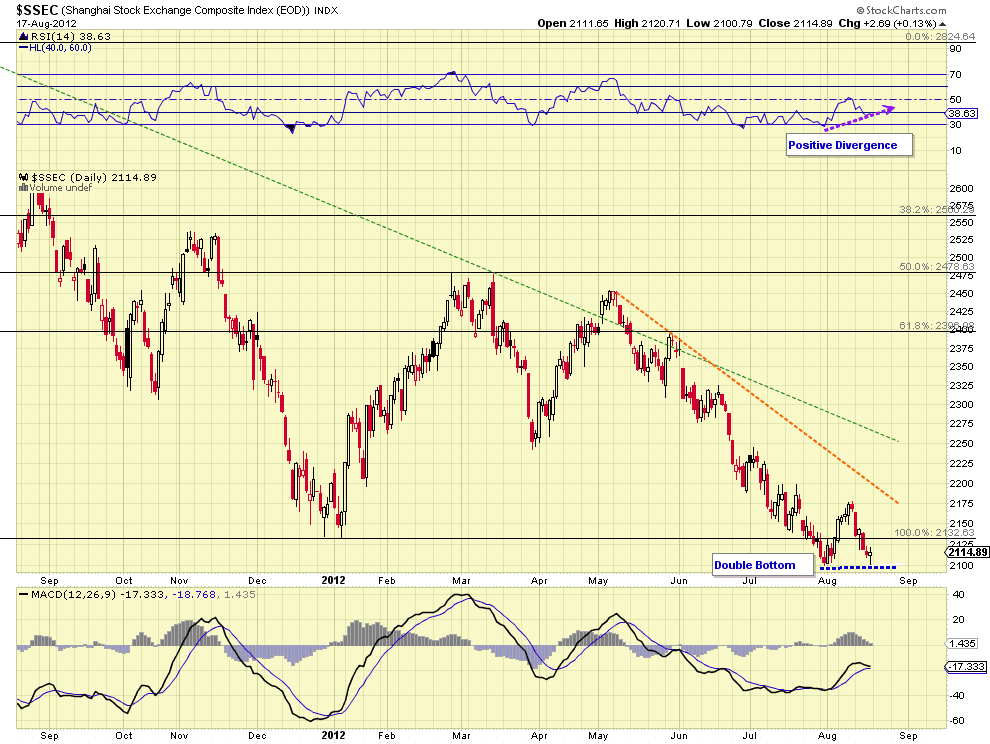
But what about Europe? What about China? What about our fiscal cliff? Due to other commitments I cannot expand on these issues in an in depth way at this time but here's a chart of the Shanghai Composite:
What about Europe? The intellectuals are continually pointing to the thesis that the EU cannot stay intact the way it is. You typically hear "Either Spain and Italy or Germany will leave the union". Yet, some thoughtful theses are coming out of think tanks and others that suggest that there are solutions to the crisis that could make the present union sustainable (http://yanisvaroufakis.eu/2012/08/17/a-modest-proposal-for-resolving-the-euro-crisis-an-abridged-version-as-published-by-the-financial-times-on-line/ ).
I've presented the issues surrounding the Euro Zone so many times and yet finding clarity toward understanding where the markets are going because of Europe is almost impossible. The only thing one can do is be correctly positioned on the right side of the news stream (like Thursday's pop on Merkel's comments). But this is largely a guess in many cases.
The next two weeks going into Jackson Hole will have Greece back on the skyline as Greek Prime Minister Samaris travels to Berlin this week seeking a two year extension on austerity targets in order to soften the impact on an already deadly Greek economic contraction. Whether he gets it or not is another question but interestingly, there is some precedent, both historically and by legal fiat, for granting the extension. If an extension were granted the markets would take very kindly toward it, sensing that German intransigence is softening.
Bernanke will not hint at an easing at Jackson Hole but will continue to encourage with a promise of further easing if it is warranted. I'm not now as sure the markets will go into a tail spin dive if he does not allude to imminent easing as I did a few weeks ago. I've spoken much about "hopium" in past blog posts and commentaries but I'm sensing that market participants may now be starting to believe this economy can stand on its own without Fed assistance.
Lastly, we must remember that the market tends to rally into the presidential election. However, this was not the case in 2008.
I'm sorry that this commentary has not been more comprehensive. Other obligations (work and personal) make composing these a challenge at this time.
Have a great week!
NOTHING IN THIS COMMENTARY SHOULD BE CONSTRUED AS AN OFFER OR ADVICE TO BUY OR SELL ANY SECURITIES, OPTIONS, FUTURES OR COMMODITIES. THE OPINIONS ARTICULATED ARE ONLY THIS AUTHOR'S WHO IS NOT A REGISTERED INVESTMENT ADVISOR OR BROKER.
No comments:
Post a Comment