In spite of low volume stocks have shown underlying resilience in that we continually see buying pressure come in on most days, even in the face of bad news. However, that may be changing. Breadth indicators, specifically the daily new highs on the NYSE as a percentage of the total volume is sporting a significant divergence from the price action:
(click on chart for larger image)
This is a daily chart of the twenty day EMA (exponential moving average) of NYSE New Highs as a percentage of total NYSE volume. The S&P 500 is superimposed behind it. The stark divergence between the new highs and price action is apparent. When the percentage of new highs is not keeping pace with the price action it's one indicator that fewer stocks are participating in the rally.
The Russell 2000 small cap Index which has been leading in this rally higher is also slowing down:
(click on chart for larger image)
The bottom panel is informative in that it shows the Russell starting to under perform the S&P 500 after an impressive three month out performance. When small caps, that have been leading the charge higher, start to lag it has been predictive of market weakness.
How long these divergences can continue without a correction is any one's guess. Laszlo Birinyi of Birinyi Associates, who is highly respected on the street and who accurately called the March, 2009 stock market bottom, has a price target on the S&P of 1740 by the end of the year. He doesn't see a correction coming but a period of essentially flat action where the averages consolidate. Who am I to argue with Laszlo but only to say market breadth is lousy!
Commodities bounced after this week's positive China trade and industrial production data. Here's "Dr. Copper":
(click on chart for larger image)
And here's Steel, bumping into resistance:
(click on chart for larger image)
The move in commodities this week on top of positive data out of China and Europe (save France on Friday) is a short term encouraging sign but we'll need immediate follow thru because we've seen these "head fakes" in commodities before.
Gold is showing signs of life. After falling out of a channel I identified as a possible bull flag pattern it popped back into the channel on Thursday and Friday:
(click on chart for larger image)
Gold's reaction was largely due to the positive data out of China which heartens the "reflation trade". Again, we need follow thru.
For all the excitement over China's trade data released on Thursday (China time) the Shanghai Composite Index didn't get too excited. Here's a ten day candlestick chart of the Shanghai and I've pointed to Thursday when the data was released as well as Friday's price action:
(click on chart for larger image)
It's pretty evident that the Chinese are not as enthused by the positive data as the rest of the global markets are. It's probably because, with the prospect of a strengthening economy, the Chinese government will be less likely to inject further stimulus into that economy.
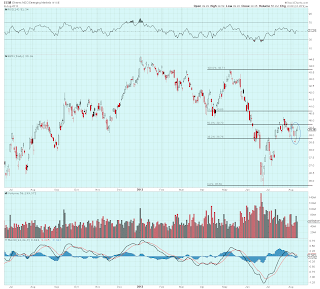
And Emerging Markets are still going nowhere:
(click on chart for larger image)
Treasuries were flat with a slight upside bias on the week which I attribute largely to nervousness regarding the divergences I identified above. I'm not even going to post the chart because nothing has essentially changed.
The US Dollar continues to weaken on the back of better economic news out of Great Britain and to the lesser extent the EU. The "even odds" that the Fed may or may not cut back on their asset purchases after their September meeting is also having an impact on the greenback. Here's a chart of the Dollar compared to the other major currencies on a three day moving average basis:
(click on chart for larger image)
To sum up, thin trading volumes and lackluster price action in all markets during these "dog days of summer" make any kind of accurate assessment of market conditions and direction a challenge. We're in "wait and see" mode looking for further verification of some upbeat stats out of China and the EU. Industrial commodities had a modestly positive week but we're going to need further validation in the form of higher prices in order to conclude that the "reflation trade" is on in earnest. Otherwise, the concerns I expressed here (http://equitymaven.blogspot.com/2013/08/another-reason-for-golds-decline.html) are still warranted.
Have a great week!


No comments:
Post a Comment