This will be an abbreviated commentary as I have a busy weekend.
Some pointed to Friday's price action as an indicator of impending weakness. I won't deny the possibility of weakness, although I would say it was not because of Friday's activity and that any weakness will be short term. On Friday, the S&P went "ex dividend" and went through some sort of re balancing. Additionally, it was a "quadruple witching" Friday which is when stock index futures, stock index options, stock options and single stock futures expire. These settlement days (settlement is actually on Saturday) are notoriously volatile and can go either way. In fact, the percentage of stocks on the NYSE that finished above their respective 50 and 200 day moving averages were higher on Friday than on Thursday when the S&P rallied 0.6% on the day. This told me that Friday's total activity was being held captive to internal market forces that had as much to do with options expiration and settlement than anything fundamentally changing in the direction of stocks.
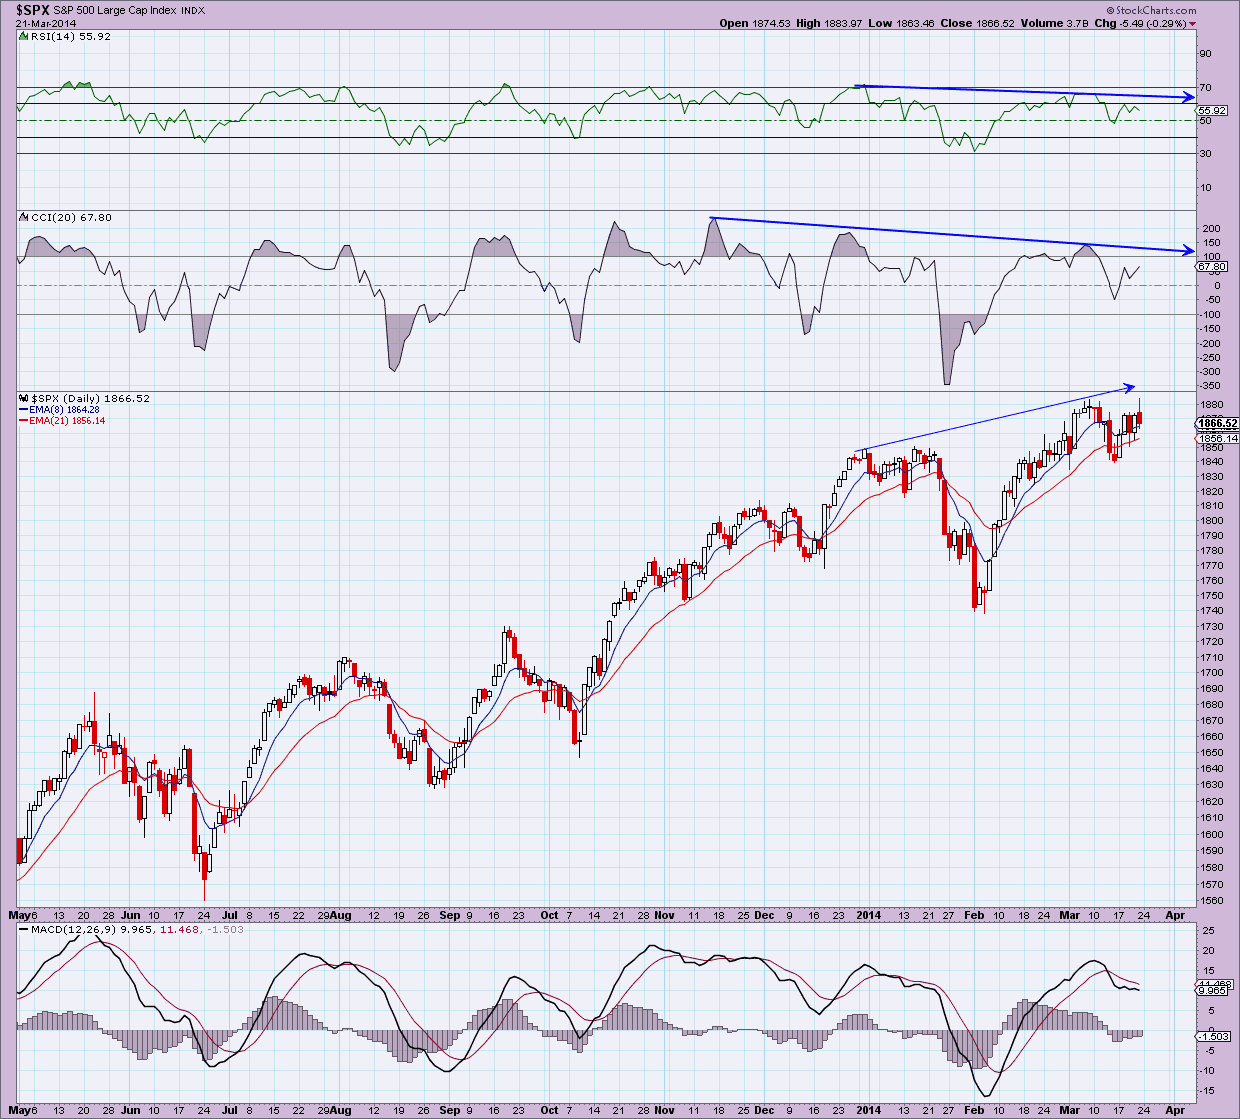
Nevertheless, most of the major indices and their sub indexes are exhibiting minor divergences that spell either a consolidation at present levels or maybe another "garden variety" 5 to 6% correction?
The weekly and the daily charts of the S&P 500 I'm posting below are indicative of the loss in momentum in equities over the past month:
(click on chart for larger image)
Notice the top panel on the charts above and below:
(click on chart for a larger image)
Whether Yellen's comment was an off hand gaffe (which is what I believe) or a thinly veiled message to investors, the S&P gapped down at least 18 points in the next minute only to recover 7 of those points before the close and short interest rate futures built in another 25 basis point increase into the first half of 2015 as the yield curve flattened.
Interestingly, although the entire yield curve backed up on Wednesday, by Friday interest rates did drop down again although not below Tuesday's lows. Nevertheless, the concern I have is that interest rates are still hanging at relatively low levels in spite of all the talk that our economy is recovering. Add that this is with all the talk that China and Japan is dumping our debt! Well, someone is buying T-bonds and where there is enough buying to lower interest rates it's still a sign that something is amiss in the US and global economy. Here's a daily chart of the iShares Barclays 20+ Treasury Bond ETF (TLT) used by traders as a proxy for the long end of the yield curve - long duration bonds:
(click on chart for larger image)
It looks like long duration Treasuries are mounting an assault on a level that's failed to have been penetrated three times before. Noticeably, momentum is not backing the move (see upper and lower panels).
There's SO much more to cover this week but I just don't have the time. My gut tells me that, outside of an exogenous shock, stocks will either consolidate this coming week at present levels or move higher. With China hinting at new stimulus to bolster their flagging economy and more relatively good economic stats out of Europe we are setting ourselves up for a strong April in the markets. Additionally, there's a lot of pent up sentiment in the US (call it cabin fever) as most of the country is anticipating spring. All we need is some more good US economic stats like we did this past week to vindicate the "weather" alibi of January and February and we're "off to the races".
I'll leave my readers with an update of a chart I've been "tweeting" all week. This chart speaks to whether the central bank experiment to ignite "cost push" inflation is finally coming to fruition :
(click on chart for larger image)
As I review what I've written above, I've posed more questions than provided solutions. Inter market relationships this week were totally skewed, especially from Wednesday afternoon on. Let's see if next week reveals any answers to the riddles I posited in this commentary.
Have a great week!


No comments:
Post a Comment