
(click on chart for larger image)
Here's a daily chart of the Wilshire 5000 Index which represents the entire US stock market. Friday's price action which was a long red candlestick (black arrow) is a very negative short term indicator. Notice momentum (top two panels) has waned significantly and we are now trading below the 50 day moving average. With all that said we still need to break the support line (red dashed line) to be able to say the market is starting an intermediate term correction.
In order for my readers to understand a longer term perspective here's a daily chart of the S&P 500 going back a little over six years:

I've drawn a trend line which has served as a resistance line until early this year (white dashed) and the yellow horizontal line (1370) has been a demarcation line during this whole period where it seems the bulls and the bears have battled intermittently over the years. We broke down under the line with Friday's price action. I'm not trying to make too much of this breakdown as we've been moving above and below that line since the beginning of the year. But from a long term perspective, the market is having a difficult time leaving this price level behind. If more selling pressure comes into this market and we penetrate the white dashed line (around 1300) it will signal a much deeper correction (down to the 1250 - 1200 area). The S&P closed Friday at 1369.10.
Treasuries were true to prevailing inter market relationships on Friday with the iShares Barclays 7 - 10 Year Treasury Bond ETF making an all time new high:

Friday's price action is highlighted with the blue arrow. I still have my suspicions about the strength we're seeing in Treasuries which I'll articulate in future blog posts but I'm not going to fight the tape. The yield on the 10 Year T-Note closed the week at 1.88% and the 30 Year T-Bond finished at 3.07%.
Commodities started the week strong only to give back all their gains by Friday. Here's an updated chart of the Goldman Sachs Industrial Metals Index. I posted this chart in my blog post early Thursday morning and you can compare the difference in the index after Friday's market action:


I personally don't believe Gold will drop below $1,600.00. It seems the $1,600.00 level is solid support and almost every fundamental factor I see in the future (save a Euro zone debt implosion) points to higher Gold prices.

I'm going to link my thesis to not only the Euro Zone but also China. One of the most challenging aspects of understanding these markets is accurately comprehending the role of central bank participation/intervention in these markets. In the case of Europe, I've often said, "Don't listen to what ECB President Mario Draghi says; watch what he does". Supposedly, ECB bond buying (the SMP program; an acronym for Securities Market Program) is not currently in effect but it's clear from the chart above that the central bank is active in European bond markets supporting Spanish and Italian debt. Otherwise, who would buy it? Would you?
Commodities started the week strong only to give back all their gains by Friday. Here's an updated chart of the Goldman Sachs Industrial Metals Index. I posted this chart in my blog post early Thursday morning and you can compare the difference in the index after Friday's market action:

On Thursday I mentioned that I would want to see a bounce off the blue dashed line for the recent positive price action to be confirmed. Instead, the index fell further on Friday; violating the down trend line. Those of you who read my commentaries know I've been concerned about the weakness in commodities since early February. Any more follow through to the downside will mean this bounce we experienced in commodities over the past two weeks was a "head fake".
Now here's where things get complicated. We've seen a steady appreciation in Chinese equities since the beginning of April. It must be remembered that commodities and the Chinese economy are normally positively correlated. Another positive correlation is the Aussie Dollar and the Chinese economy:

This is the Dow Jones China Broad Market Index which encompasses all Chinese related equities. I'm monitoring an inverse head and shoulders chart pattern which is potentially bullish. I've delineated the shoulders and head as well as the neckline. We closed right on the neckline on Friday (black arrow). If we clear the neckline to the upside the formation will be consummated with a price projection up to the 360 - 370 level. Notice the MACD momentum indicator in the top panel signalling strong momentum. But the traditional correlations are breaking down! Both the Aussie Dollar and industrial metals are presently negatively correlated and refuse to confirm the price action in Chinese stocks. I'll be presenting my thesis on these negative correlations and other concerns I have at the end of this commentary.
Gold had another "do nothing" week, meandering between $1675.00 and $1625.00 and here's an updated version of an inverse head and shoulders formation I've been monitoring for weeks:

That right shoulder is getting pretty stretched out! But, as I've stated in past blog posts, the formation needn't be perfectly symmetrical. However, if Gold breaks down below the $1,625.00 level I would say the pattern was negated at that point. If it drops below $1,600.00 then the next stop is $1,500.00.
Here's the US Dollar Index:

Dollar price action has been quite constructive in the past week. We bounced off the 61.8% Fibonacci retracement level and we're still in the massive consolidation triangle (purple dashed lines). But we also pierced a shorter term support turned resistance line (lime dashed). A stronger dollar points to lower stock and commodity prices and is correlated to strengthening Treasuries (as we've seen above).
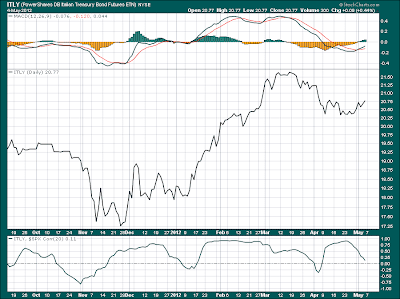
I'm going to post one more chart:

This is the Powershares DB Italian Treasury Bond Futures ETN (Exchange Traded Note). This is a proxy for the Italian bond market. The strength exhibited on the chart since the beginning of the year closely tracks the timing of the two LTROs (Long Term Financing Operations) conducted by the European Central Bank to pump liquidity in the European banking system. Many of the banks that came to feed out of the ECB trough were Italian and Spanish banks. They, in turn, used some of that money to firm up their balance sheets but also to buy their own sovereign debt. One could liken the activity to financial incest. You can see the drop off in price starting in mid March and we are basically flat but momentum is starting to turn positive (top panel).
In the continuing Euro zone debt saga one of the key indicators used in determining whether the crisis is intensifying is monitoring the daily interest rates on the debt of Portugal, Italy and Spain. The chart above attests that interest rate pressure on periphery debt is easing. Yet, it's universally accepted that Spain is insolvent and everyone won't even speak about Italy's problems! So, why are rates falling while in the past, under the same ominous cloud, they would be skyrocketing?
To some extent I also believe the Chinese government is involved in bolstering Chinese stocks. Admittedly, here's where my thesis gets much more speculative. China is an extremely secretive country for obvious reasons. Yet the correlations I identified above cannot continue as they are with a chart showing a supposedly strengthening Chinese equity market. China has a voracious appetite for commodities, devouring over 25% of the world's available supply of industrial commodities annually. And the Australian Dollar has always tracked the Chinese economy closely as the bulk of Australian exports end up in China.
So where are we going in these markets?
1. I believe the seasonal factors I've identified in past blog posts will impede any progress in US equities in the coming months. Another factor that will exacerbate this is the FED's cessation of "Operation Twist" on June 30th. Indeed, I believe the market weakness we are seeing is partially due to this fact. Can world markets stand alone without the crutch of central bank liquidity? The correct answer to that question determines whether the bulls or the bears win the battle for Mr. Market. If this economy is as strong as the bulls perceive then equities will shake off the seasonal factors I've identified and rally into the fall. And, of course, if the FED surprises with an extension of "Operation Twist" or a new bond buying program, US and global equities will take off.
2. As long as Draghi and the ECB continue to support insolvent sovereign countries we will at least forestall the grand sovereign debt crisis. I believe the ECB will continue to prop up Spanish and Italian sovereign debt and as of this writing, the European Union and the International Monetary Fund have accumulated 1.3 Trillion Euros as a backstop in averting a bond market implosion. Unfortunately, as impressive as that number seems to be it is not enough. I also expect a political shock coming out of Europe soon as a result of the Greek election. Everyone is focusing on France where it's pretty clear that Hollande, a Socialist, will beat Sarkozy. I'm not worried about Hollande; he'll be another Mitterand and fit well into the Euro zone political power structure. But I'll reiterate my prediction that Greece will renege on their commitments to the EU and leave the European Union. Ultimately, this in itself will not be dangerous for the global economy (although risk assets will initially sell off) but the event will fuel a virulent contagion within the Euro zone with much more selling pressure on equities and commodities as a result. I know this is a bold prediction but as I look at Greece's predicament they are finally at a point that they have nothing to lose in leaving the EU. If you knew you were destined to destitution for the next decade and had a choice between being some one's slave during that time or controlling your own destiny, which would you choose?
3. China can be a strong counter balance in assisting the global economy avoiding another recession. But is the present strength we are seeing in Chinese equities symptomatic of a Chinese economic recovery? The negative correlations we identified in this commentary must reverse to confirm the strength we are seeing in Chinese stocks.
The US Economic calendar is relatively quiet this coming week with the only noteworthy releases coming on Thursday with jobless claims and Friday's release of April's Producer Prices. Ben Bernanke speaks on Thursday. His comments will be dissected into oblivion by market participants; to the point of analyzing adjectives and adverbs!
In Europe, the calendar is even quieter with Draghi speaking on Tuesday and two Italian bill auctions going off on Friday.
Have a great week!
PS. As of the time of this posting it's been announced that Hollande has beaten Sarkozy in France and exit polls in Greece suggest a fractured parliament. Dow Futures are down about 190 points! Buckle up your seat belts! :-)
NOTHING IN THIS COMMENTARY SHOULD BE CONSTRUED AS AN OFFER OR ADVICE TO
BUY OR SELL ANY SECURITIES, OPTIONS, FUTURES OR COMMODITIES. THE OPINIONS
ARTICULATED ARE ONLY THIS AUTHOR'S WHO IS NOT A LICENSED INVESTMENT COUNSELOR OR
BROKER
No comments:
Post a Comment