(click on chart for larger image)
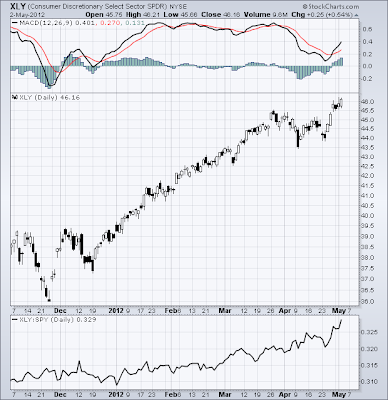
This is the Consumer Discretionary ETF and as you can see, it's on a tear! Notice the price relative chart on the bottom panel. It is outperforming the S&P 500 significantly. This is speaking to a stronger economy folks!
However, inter market relationships are distorted. Here's the Barclays iShares 20+Year Treasury Bond ETF:
As stocks rally, Treasuries should be selling off but we are seeing just the opposite. While it's true that this chart is less than impressive (notice momentum is rolling over in the top panel) until we see a definitive downturn in Treasuries we have to question the rally in stocks.
And here's what commodities are doing as represented by the Goldman Sachs Industrial Metals Index:
From a survey of just these three charts we have to say that the Bulls are winning this market battle but there is no "all clear" in the market. But when is there ever? :-)
Obviously, there's a lot more going on here but it's an extremely busy week. Gotta go!


No comments:
Post a Comment