At the risk of being premature or even wrong I'm going to say that we are in the very beginning of a secular bull market very much akin to the 1980's. And the present price action is eerily similar to the last quarter of 1982, where, after a ferocious bear market, unbelieving Wall Street stood by while stocks rallied in the face of the then worst recession since the Great Depression. What followed was the greatest bull market in financial history.
Now, I have to grant that this time around is different. Demographics played just as much of a role in that incredible bull run as Fed policy or Reaganomics. But I contend that while the magnitude of the present bull may never match that great bull, they may well end up being the same in kind.
For those of you who regularly read my commentaries I want to thank you. I know I'm starting to sound like a broken record but this will yet be another shortened commentary. What started out as a miserable cold last weekend morphed into a full blown bacterial infection that left me bed ridden until today. I'm still recovering.
My format will be different as well so I can present the evidence for a thesis I know few will agree with.
Let's start by looking at stocks. Here's the S&P 400 Mid Cap Index which continues to push into new all time historic highs:

(click on chart for larger image)
Here's the Russell 2000 Small Cap Index:

(click on chart for larger image)
The Russell also continues to surge into new all time highs and this week broached the 900 level.
Finally, and most impressively, here's a weekly chart of the Wilshire 5000 Index going back to mid 2006. It's comprised of the total of all US equities traded on all exchanges:

(click on chart for larger image)
The Wilshire closed Friday at a new all time historic high of 15878.82, besting the previous all time closing high of 15798.30 set on October 12, 2007. The fact that this index has penetrated previous multi year resistance and is at historic highs speaks to much more than a simple garden variety rally. The entire US equity market is moving higher in unison! This IS indicative of the beginning of a secular bull market!
Let's look at Treasuries. As per our inter market relationships we should be seeing commensurate weakness in the Treasury market as stocks move higher. Here's a daily chart of the Ten Year US Treasury Note yield with the S&P 500 transposed behind it:

(click on chart for larger image)
As a brief primer, as bond prices weaken yields move higher. Yields therefore, are positively correlated with stock prices.
If you study the chart closely, yields and stock prices track pretty closely with any divergences eventually correcting themselves. I had been concerned about the most recent divergence as yields had been dropping in the past two weeks but Thursday and Friday's action in the Treasury market finally corrected that short term divergence.
The length and strength of this present "bull leg" will largely be determined by the magnitude of the acceleration of investor money out of the safe haven of Treasuries and into equities. With Treasuries yielding negative real interest rates investors are losing money sitting in Uncle Sam's debt. With potential global Armageddon scenarios presently extinguished there is no reason for the trillions of dollars in Treasuries to remain there.
Expect the migration of monies from bonds to stocks to progress slowly at first as scared investors, having been conditioned to four years of historic radical volatility, at first dip their feet into the water and then wade in up to their waist and then finally take the plunge into stocks.
The Fed's job during this transition will be to insure price stability in the Treasury market, especially if bond redemptions take off. Obviously, the explanation behind this scenario is much more complex and how the Fed handles this great "unwind" will largely determine inflationary expectations going forward but we will be addressing these issues as they come to the fore in coming months.
Gold is also telling us that this bull market in stocks is real:

(click on chart for larger image)
This is an updated chart I've posted innumerable times of Gold's spot price. The red arrow points to a resistance area Gold has failed to penetrate since early December. Also notice the succession of lower highs and lower lows since early October.
Gold is sensing higher interest rates and Gold doesn't like higher interest rates (unless its in an inflationary environment) because higher interest rates compete with Gold for investor dollars. Gold always loses such a competition because you don't get paid to hold it.
As I stated in last week's commentary, Gold's fortunes are waning and much of the hopes of the "gold bugs" on the continuation of the decade plus gold rally will depend on how well the Fed can unwind it's three trillion dollar Treasury/MBS book. Many are saying it will be messy. I'm not making any predictions. All I'm going to say here at this time is two things:
- some inflation is inevitable going forward
- the kind of inflation we experienced in 1978 - 1980 is the minority scenario.
Finally, the FOREX market is giving the green light to this rally as well. I'm posting a one and a half year daily chart of the Euro to highlight a technical formation that regular readers of my commentary have seen before. It's a variation of the classic head and shoulders formation. Typically, this is a distribution pattern and is bearish. But on the chart below it is an inverse head and shoulders formation which is an accumulation pattern and therefore bullish:
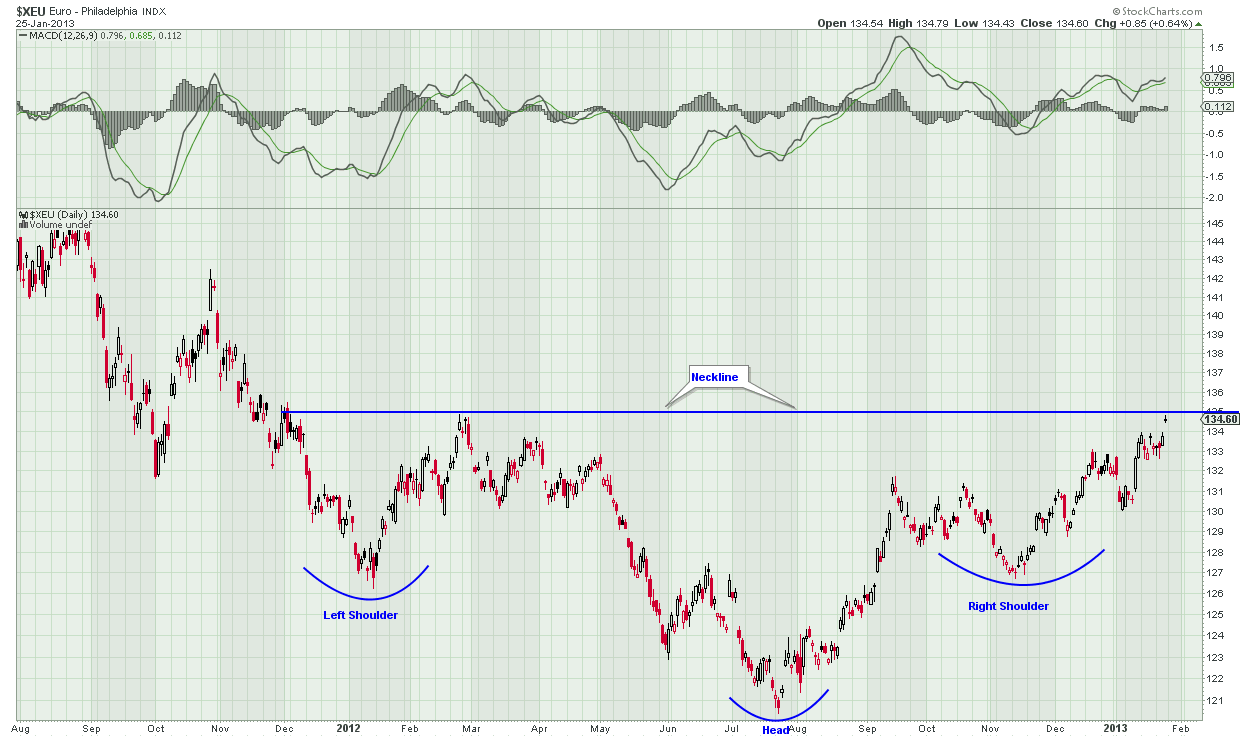
(click on chart for larger image)
Remember, the Euro is a "risk on" currency and is highly correlated to equities. The Euro and US stocks rally and sell off in tandem.
The Euro closed on Friday at 134.60. If we break the neckline I've delineated at 135 the pattern projects an upward move to Euro 150. Now, do I believe we will get there? Of course not! European exports would drown and the ECB would intervene in both the bond and FOREX market to stop such an appreciation. But my point is any move toward Euro 140 will pour fuel on this rally we're seeing in stocks. And I expect the Euro to take out the 135 level.
In the short term many are expecting an overdue correction in stocks after an incredible run up in January. To this, I don't disagree other than to say the slow deliberate price action higher is not consistent with an imminent correction. Ideally, we would want to see some volatility and price destabilization. And we haven't thus far. Maybe this coming week will provide the catalyst for a pullback with Durable Goods on Monday, GDP on Wednesday and the Monthly Employment Report on Friday. I personally am positioned for another higher week. My Fibonacci price extension target at around 1523/1528 on the S&P is looking a bit aggressive at this point and I heard that "Fibonacci Queen" Carol Boroden has a projection to 1511 before a rest. I'll defer to her but if we blow past 1511 look for my targets.
Well, that's it for now. I know I made a bold prediction and any number of objections can be thrown at me but it was the same way in late 1982. The world looked awfully bleak back then as well. I've been tracking these markets most of my adult life and my intuition is telling me we're on to something big. If I'm wrong, I'm wrong. But hey, the advice is free ... :-)
Have a great week!NOTHING IN THIS COMMENTARY SHOULD BE CONSTRUED AS AN OFFER OR ADVICE TO BUY OR SELL ANY SECURITIES, OPTIONS, FUTURES OR COMMODITIES. THE OPINIONS ARTICULATED ARE ONLY THIS AUTHOR'S WHO IS NOT A REGISTERED INVESTMENT ADVISOR OR BROKER ... yet!
No comments:
Post a Comment