Consumer confidence also soundly beat expectations and this on top of the payroll tax increase which everyone was worried about that kicked in at the beginning of the year. Lastly, the ISM Manufacturing Index also blew away expectations as did monthly construction spending.
And lest we think the good economic news was confined just to the US, the Norwegian, Spanish, Italian and German Industrial PMIs all beat expectations (though still in contractionary territory). France was the only disappointment and its PMI came in flat.
The major indexes responded with a rally which reversed what looked like the beginnings of a correction on Thursday. At this point we only have four major indexes that have not reached all time historic highs. Two of these, the NASDAQ Composite and the NASDAQ 100 will not get there for years. Here's a weekly chart of the NASDAQ 100 going back 15 years:

(click on chart for larger image)
As can be clearly seen, the highs reached around the turn of the century in the 4800 area may take years to reach. But not so with the following two indexes. Here's the weekly chart of the Dow Jones industrial Average and the S&P500 below it:

(click on chart for larger image)

(click on chart for larger image)
We're literally a stone's throw away from all time highs in both the Dow and the S&P and we could be there in a matter of weeks if Washington will cooperate. But even if we get more volatility as Act Two of the "Fiscal Follies" commences, both these averages will have surpassed their previous historic highs by May. More on this below.
Treasuries got walloped on Friday and we may be seeing the very first leg of the great unwind out of Treasuries and into stocks taking place. This is a daily chart of the iShares Barclays 20+ Year Treasury Bond ETF and I circled last week's price action which culminated in that long ugly candlestick on Friday:
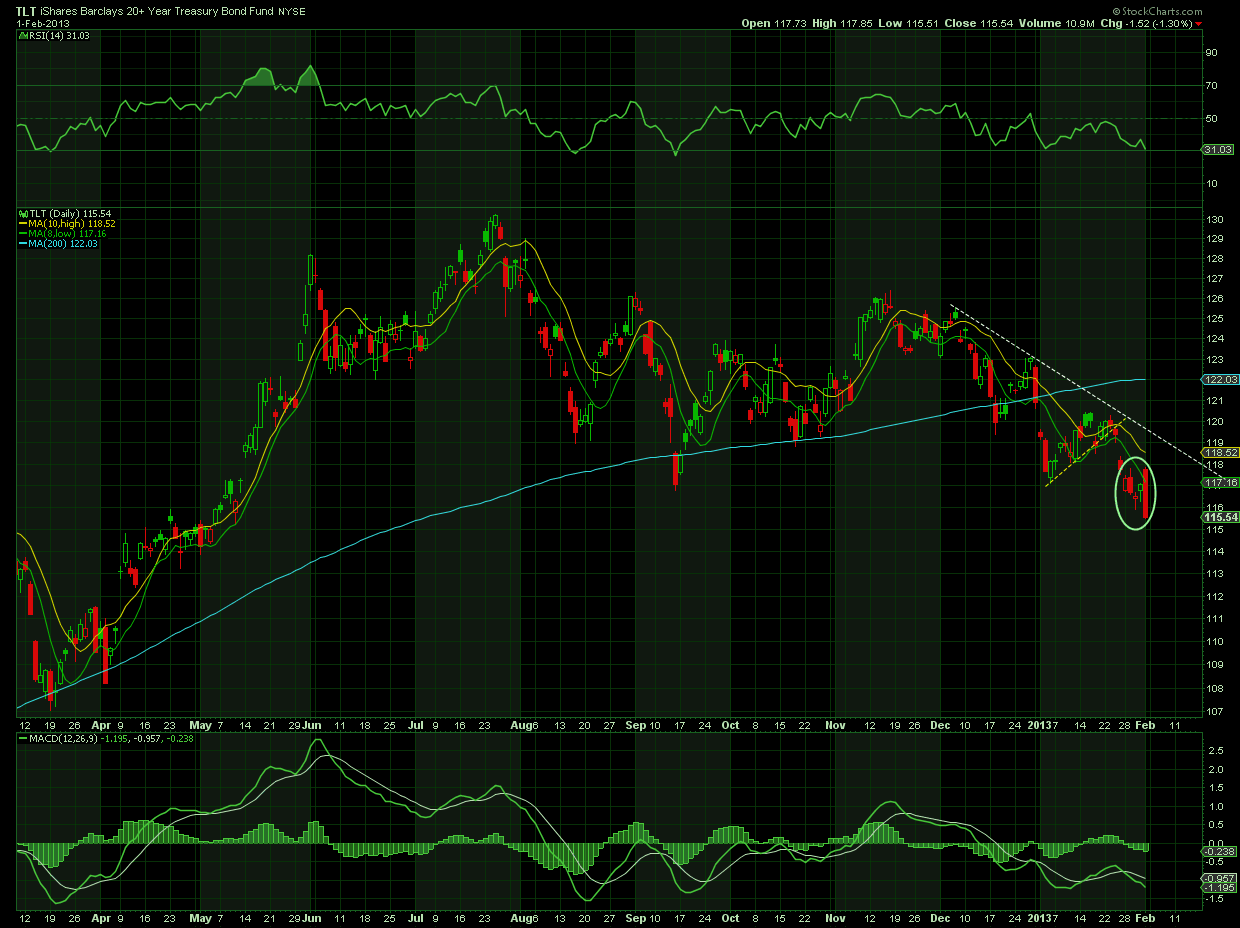
(click on chart for larger image)
I watch Treasuries as well as the EURO/USD currency pair constantly during the trading day because even on an hourly or 30 minute basis the inter market relationship (inverse correlation) between them and stocks is very strong. On Friday after the employment report in the pre market treasuries were in rally mode which was not a normal response to a strong employment report. At the opening bell they swooned and continued the rout until the end of the trading session. If this is the beginning of the movement out of Treasuries and into equities it will confirm my bullish thesis for stocks.
Gold had another tough week and can't seem to get its bearings:

(click on chart for larger image)
I circled this week's price action and Gold's best day was on Wednesday as it had a positive reaction to the latest Fed assessment on the economy and their reiteration of 85 billion of MBS and Treasury purchases going forward. But Thursday was a key reversal with a bearish engulfing candlestick and Friday finished the week with a huge "doji" candlestick which signals indecision but I think was more telling of confusion in the gold market. As treasuries weaken and yields rise gold will weaken in a commensurate way.
I had a thoughtful reader last week who stated the oft heard complaint made by many gold bulls that the spot and futures price of Gold and Silver is being manipulated. I want to expand on this subject just a little bit. I would be naive to think there is no manipulation by powerful interests in ALL the financial and commodity markets. The most manipulated market in the world is the FOREX market. Heck, central banks announce when they're going to manipulate it! And there has been some evidence presented that seems to suggest that gold prices have been manipulated in the past. My objection to the complaint is that its not going on with the frequency charged by the "gold bugs". And when I can confirm a market's movement with economic fundamentals (in gold's case, inflation/deflation fundamentals) I have to dismiss the "manipulation" charge as the primary mover in a market.
In gold's case, the rally on Wednesday quickly faded as all previous rallies have because inevitably, precious metals traders capitulate to the ever growing credible thesis that inflationary forces in the economy are ephemeral. Many gold bugs are still focused on the great inflation of the late 1970's not understanding that the main driver of that inflation was tight labor market conditions and subsequent wage inflation that drove those inflationary pressures in the economy. We have no such pressures this time around and until we do we will not see the type of inflation that we saw back then.
I could write much more on this topic but I don't feel like spending my entire Saturday composing my grand thesis on inflation. I'll just end here by saying that the latest Velocity of M2 Money Supply released by the St. Louis Fed has turned down again. Until we see a meaningful uptick in the velocity of money the Fed can continue to print money until every kitchen in America could theoretically be wallpapered with dollars and there will still be no meaningful inflation!
Commodities finally had some movement this week although they still need to clear a short term resistance line and then surpass their previous highs made in September when Ben Bernanke announced QE3. Here's a weekly chart the Dow Jones UBS Industrial Metals Index:

(click on chart for larger image)
We had a big move to the upside this week but the index has temporarily stalled at the dashed white line (white arrow). Look for a push through that resistance next week.
And Brent Crude has been staging its own stealth rally:

(click on chart for larger image)
This is a weekly chart and I highlighted the three week rally with the white arrow. I didn't want to post a daily chart because it might give some readers the wrong idea that oil prices are getting out of control. The weekly chart gives a better perspective on price.
Folks, the oil/NATGAS story is just beginning! Russians and Saudis are already worried about their waning influence on the global geopolitical stage. Pay back's a bitch! It's our turn! Energy independence and the subsequent geopolitical clout due to that independence will be a legacy that our great grandchildren will benefit from.
In the near term, market forces that are heavily dependent on distribution channels and access to refineries still drive the price of "black gold" and we will see the price remain in the 3 to 4 dollar area for most of 2013. But if the Obama Administration eases up on some of the strictures it's put on the industry (and my hunch is they will so as to avoid spending cuts) we're going to see the price gradually drop over time. How low can it go? Some think tanks are speculating oil could be at $50.00/barrel by 2015! I think that's a bit aggressive. Much will depend on the following points:
1. The time it takes to set up the pipeline infrastructure to get "bakken crude" to refineries on the east and west coasts so we can break the stranglehold Brent crude has on those markets.
2. Technological advances that will be needed in order to make it profitable for corporations to pull the stuff out of the ground where ever it is. This is especially relevant to NATGAS where fracking techniques can become very expensive depending on the geology of the areas where NATGAS deposits are identified. There are presently some areas in the country with NATGAS reserves that it is not cost effective (based on present prices) to frack.
3. The demand/supply/cost of production quandary I identified in point two may cause some supply disruptions and pricing volatility in the short term although it's virtually impossible to state just what the impact will be. It could be nothing or it could be considerable.
All in all though, I cannot emphasize enough the wealth effect and the incredible impact that these discoveries will have on our nation going forward. Eventually, it will have an enormous impact on the US Dollar ... but not right away ...
Here's our beloved Dollar and the Euro posted below it:

(click on chart for larger image)
The Dollar has some intermediate term support at the 79 level. As per the inter market relationships that have dominated the financial markets for the past twelve years our stock rally has coincided with a Dollar sell off and commensurate strength in the Euro which has broken out of a bullish one and one half year inverse head and shoulders formation:

(click on chart for larger image)
As discussed last week, the formation above projects a theoretical price target of up to Euro 150. And as I also stated last week there is no way the Euro will get that high unless EU officials want to commit economic suicide. Nevertheless, while the rest of the world has clearly embarked "on a race to the bottom" in currency debasement the EU seems quite content with a stronger Euro.
Some of my readers may wonder why I focus on the Euro so much. Simply, as the planet's main "risk on" currency, a strong Euro is predictive of and more often coincident with rising equity prices. And we saw that this week as equities, as tired as they recently have been from an historic January run up, couldn't even stage a tepid pull back. And that is largely because of the chart above.
But there's also a message in the chart above that I believe is giving me a potential short term sell signal in stocks this coming week. Friday's candlestick was a "doji" which is signaling indecision. The ECB (European Central Bank) meets this week and while there is liable to be no change in their interest rate regimen at this time all ears will be attentive to Mario Draghi's news conference on Thursday, February 7th and any comments he may make regarding recent Euro strength. Any negative comments will spark a sell off in the Euro and will be a short term negative for our equity market. Technically, such a move would be consistent with price action that typically occurs after a breakout. Often, after initial penetration of resistance, price action will return to the breakout area as if to "kiss" former resistance goodbye. In the Euro's case, a normal retracement back to 135 (it closed on Friday at 136.41) would be healthy before a resumption of its uptrend.
China Watch
Here's the latest chart on the Shanghai Composite:

(click on chart for larger image)
It doesn't get much more parabolic than this! Obviously a pullback would be healthy but my point in posting the chart is that stocks don't act like this if the economy is flat or weak.
Analysis
In the short term, we're staring at a week coming up that's light on economic news. That could mean a drift higher or some profit taking. Traders on the floor of the NYSE feel that upside momentum could carry through to the new week but I've already highlighted my intermarket concerns surrounding the Euro above. And if there's nothing else that fills the news void the FOREX will fill that void!
We're also coming into February, which historically is not kind to the market, especially since 2008. The S&P has exceeded "Fibonacci Queen" Carol Boroden's Fibonacci extension target of 1511 but I'm not willing to proclaim an imminent run up to my target (1523) until I see how the ECB meeting goes on Thursday.
The market's tired and as we move into the month all eyes will begin to turn once more to Washington and how our elected officials are going to deal with "sequestration" - mandated spending cuts that are due to kick in on March 1st. Now, I'm ultimately of the opinion and have a basis to defend this position that sequestration will be taken in stride by the economy. Part of my rationale is based on the 50 billion Congress just allocated to "Sandy" victims but on top of that the billions P&C carriers are in the process of paying out to victims of that natural disaster. The Northeast will be humming throughout 2013! This additional stimulus will effectively neutralize the economic drag of fiscal cuts. And however remote the possibility may be, we cannot rule out people on both sides of the aisle in Washington actually coming together and negotiating a better set of spending cuts than the automatic sequester. I'm not holding my breath on this point but I do believe the ultra conservative fringe of the Republican Party has been isolated in the aftermath of the fiscal cliff debacle. Additionally, the tenor coming out of the Republican meeting in Virginia is much more conciliatory than we have seen since early 2011. As far as the liberal fringe of the Democratic Party goes, they always were more flexible if only because they tend to be a much more nebulous, fractious force in Democratic party politics and, in essence, can be bought :-)
However it shakes out, this is the only remaining issue we know about that has the potential to roil our market. And a cogent case can be made that the market has become inured to all the volatility of the past few years and recent evidences in December, 2012 suggest that any upcoming volatility may be substantially muted.
That's it folks. I basically said the same thing last week but this market is heading substantially higher and even an exogenous shock won't derail this rally.
Have a great week!
NOTHING IN THIS COMMENTARY SHOULD BE CONSTRUED AS AN OFFER OR ADVICE TO BUY OR SELL ANY SECURITIES, OPTIONS, FUTURES OR COMMODITIES. THE OPINIONS ARTICULATED ARE ONLY THIS AUTHOR'S WHO IS NOT A REGISTERED INVESTMENT ADVISOR OR BROKER ... yet!
No comments:
Post a Comment