The reason for the relative weakness last week depends on who you listen to. The popular view is that the Fed statement after their meeting on Tuesday and Wednesday had a "hawkish" tone. After reading the statement twice I failed to see anything "hawkish" in it. But the market reacted nonetheless to the pundits who read these "tea leaves" and from Wednesday afternoon until Friday's close all asset classes were captive to this popular interpretation.
Here's a three month daily chart of the S&P 500 with the week's price action circled:

(click on chart for larger image)
If you believe in the popular view stated above it would seem evident that the market now considers the possibility that "tapering" of asset purchases could come in December.
Small cap stocks took a beating this week but decisively bounced off of Fibonacci support on Friday. Here's the Russell 2000:

(click on chart for larger image)
The Russell broke down under gap support that was formed on October 18th but had a nice bounce off of the 38.2% Fibonacci retracement level. If we can hold this level early next week it will confirm the shallow nature of this pullback.
At this point in the rally there are a number of momentum and breadth divergences that are developing in the indexes as well as the sector ETFs that are a cause for concern. Here's one that's a bit glaring. It is the percentage of stocks on the NYSE trading above their 50 day moving average:

(click on chart for larger image)
Here's another divergence in an important sector ETF, the Finance Select Sector ETF(XLF) that tracks US money center banks. This is a daily chart of the XLF Advance-Decline Volume line:

(click on chart for larger image)
While XLF continues to make consecutive highs buying pressure in the ETF is not keeping up with the new highs.
I cannot ignore these divergences and so must admit that the market is ripe for a pullback. However, these divergences are relatively minor and do not signal anything more than a garden variety correction in an ongoing bull market. I'm still holding to new all time highs on the S&P 500 by year end. We have seasonality behind this move higher and as we close in on year end there will be a push by hedge funds and mutual funds who's performance is lagging the S&P 500 to match that benchmark. The only thing that can negatively impact my thesis is the possibility that the Fed does taper before the end of the year.
Treasuries took their cue from the misreading of the Fed minutes and interest rates across the yield curve rose in anticipation of less Fed accommodation. Here's a daily chart of the Ten Year Treasury yield with the week's activity circled:

(click on chart for larger image)
And, of course, after my call on gold in last week's commentary, the yellow metal acted appropriately to the market's misguided interpretation of the Fed statement and sold off:

(click on chart for larger image)
And, of course, our beloved Dollar rallied because now the possibility of the Fed tapering sooner rather than later implies higher interest rates which makes our currency more attractive than foreign currencies:

(click on chart for larger image)
Analysis
The market gave itself (in my opinion) a self inflicted wound on Wednesday afternoon after the Fed released their statement that reiterated their intention to maintain their asset purchases. Market pundits seemed to focus in on the fact that the statement did not mention the potential negative effects of the recent government shutdown. The prevailing wisdom was that this must inevitably mean that the central bank might pull the trigger on tapering earlier than most on the street expected.
I read the statement and it was virtually unchanged from last month's statement. The Fed did acknowledge that financial conditions weren't as tight as last month but that the mortgage market was incrementally weaker due to the recent rise in interest rates. In my mind, nothing changed but all of a sudden there was talk that the Fed might taper sooner than next year. So the market showed the first sign of weakness since early October.
To me, the price action was symptomatic of "buy the rumor; sell the news". My thesis is that the market was already tired and needed a rest. Interestingly, a similar scenario took place at about this same time in 2010 after stocks staged an impressive surge after Ben Bernanke's Jackson Hole speech announcing QE2:

(click on chart for larger image)
While the pattern is not exact because we had the political issues in Washington the general framework is the same this time around:

(click on chart for larger image)
I have settled on a thesis that the Fed will not cut back on their asset purchases until at least next year. And the rationale behind my thesis is fairly simple. Inflation is dangerously low. I know others on the street point to weak employment numbers or uneven, tepid economic numbers as reasons for the Fed not acting but a low inflation rate encompasses all those other factors. In a fiat currency system, normal inflation is indicative of healthy economic growth. And we have had anything but normal inflation. Here's a chart of headline and core PPI (Producer Price index) courtesy of dshort.com:

(click on chart for larger image)
Chart courtesy of dshort.com
The headline Producer Price Index is the lowest it's been since the depths of the 2008 - 2009 recession. The PPI less the volatile food and energy group is running at only a 1.2% inflation rate.
These numbers are way too low for the Fed to take a chance that any reduction in asset purchases would stifle economic growth and force the economy into deflation.Here's another chart from dshort.com comparing the percentage change of the Core PPI and the Core CPI since 2000:

(click on chart for larger image)
Chart courtesy of dshort.com
In the article where I pulled these charts from it states, "... the Core Producer Price Index is more volatile than the Core Consumer Price Index. For example, during the last recession producers were unable to pass cost increases to the consumer. Likewise in 2010 the Core PPI generally rose while Core CPI generally fell. Since 2012, Core PPI has steadily trended downward, and since January of this year, Core PPI trended below Core CPI." Nonetheless, regardless of volatility, both CPI & PPI have tracked each other closely except for relatively brief periods since 2000. The spike in PPI in 2008 can be attributed to the correlative effect of the incredible spike we endured in the oil market. While the chart above excludes the volatile oil and food groups, the impact of those higher oil prices found its way into the basic materials and industrial metals that industry uses through higher transportation costs.
Additionally, European inflation has also fallen to dangerously low levels. Euro zone CPI rose only 0.7% in October compared to a 1.1% reading in September. This is the lowest inflation rate in Europe since November, 2009. And while the Fed is only concerned about monetary policy in this country, any alteration of monetary policy from our central bank would only exacerbate European challenges in this area.
We are also seeing signs of weakness in the housing market as the prospect of higher interest rates makes mortgages less affordable. Here's a daily chart of the iShares Dow Jones US Home Construction ETF (ITB):
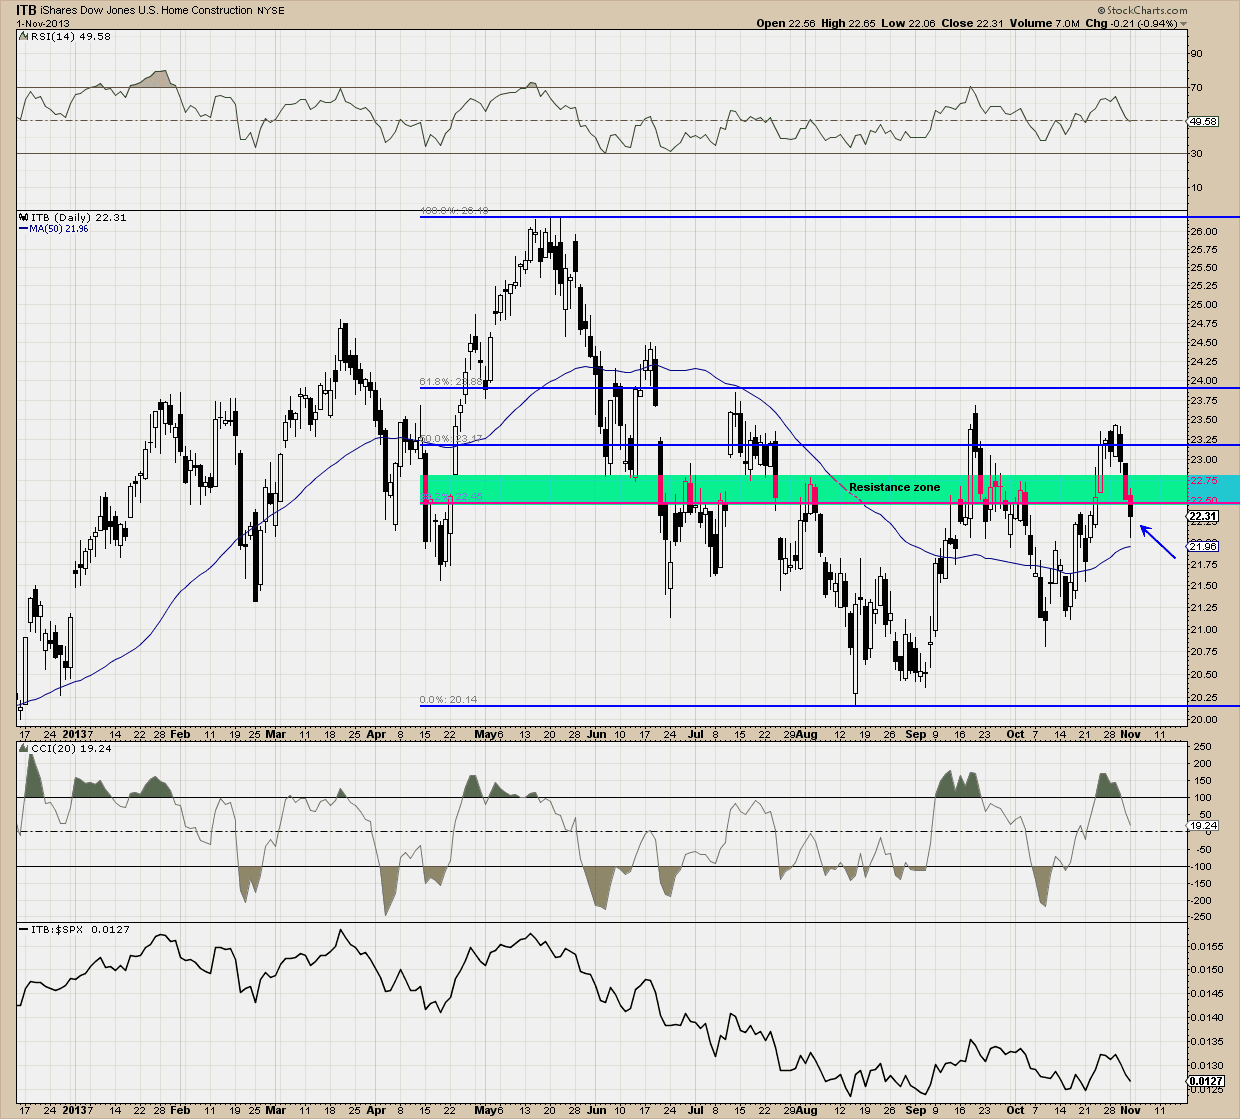
(click on chart for larger image)
Lastly, with Janet Yellen's confirmation as Fed Chairperson coming up and a change in leadership in the Fed, I believe we are not going to see any significant change in policy before she's in charge. The leadership change takes over in February and that is why many were targeting next March's meeting as the first possible time when the Fed would seriously consider a tapering. I'm not going to speculate on which meeting it will occur because, depending on how 2014 unfolds, it may not occur.
What could change my thesis on the timing of the Fed taper? A significant jump in the PPI and CPI in November. By significant I mean something near the Fed's target of 2%. Do I see anything on the horizon that would make this possible? Only obtusely.
Oil is selling off as worldwide supply is outstripping demand. Depending on where you live you are seeing prices as much as $.50 cents cheaper than a month ago. I can get gas at selective gas stations in San Antonio for $2.99/gallon. Lower fuel costs are good for the economy as it frees up money for more discretionary uses. But whether this could filter into the economy and pressure prices by the end of the year is doubtful.
Industrial metals are basing as I've stated in past commentaries but at a grudging pace. Here's a weekly chart of the Dow Jones UBS Industrial Metals Index ($DJAIN):

(click on chart for larger image)
We finally broke a long term downtrend line a few weeks ago but the long wicks on the weekly candlesticks I circled tell me there's very little impetus for a significant move higher in these industrial commodities.
Summing up, stocks need a rest. We should see a correction or churning between sectors over the next few weeks. I'm partial to the churning thesis because I cannot fathom a meaningful correction with the Fed pumping in 85 billion dollars a month into our economy, the vast amount of which is being funnelled into paper assets. However, the idea that the market reaction this week was the result of a "hawkish" Fed statement is simply misguided. If the Fed were to ignore the data and facts I've presented in this commentary and taper by December, they do so at their own peril and risk a recession in 2014.
I'm still targeting the S&P 500 at 1860 by year end.
Have a great week!
No comments:
Post a Comment